Predicting Dust Storms with Infrared Satellite
A method for predicting dust and sandstorms using infrared satellite images has been developed by researchers based at the University of Pittsburgh (USA). They can determine when conditions are ripe for these destructive phenomena, a technique that could be implemented globally and that they used to forecast a 2008 New Mexico dust storm, the area's largest in decades, two days in advance.
Thermal and visible images of New Mexico's White Sands Dune Field captured by NASA's Earth-orbiting ASTER (Advanced Spaceborne Thermal Emission and Reflectance Radiometer) instrument reliably indicated when soil moisture levels were low enough to result in a dust storm, the team recently reported in the Journal of Geophysical Research Earth Surface. Lead author Stephen Scheidt, a research associate in Pitt's Department of Geology and Planetary Science; Michael Ramsey, a Pitt associate professor of geology and planetary science and member of NASA's ASTER science team; and Nicholas Lancaster of Nevada's Desert Research Institute further determined that this approach could be expanded into a worldwide system to monitor areas prone to dust storms or to track drought in regions threatened by desertification.
The group analysed day- and night-time images of White Sands ASTER captured between May 2000 and March 2008. Unlike microwave satellite instruments typically used to observe arid regions, ASTER can collect high-resolution data that allow small-scale surface details to be observed in various wavelengths, from visible light to thermal infrared. By studying thermal infrared images of moisture content and albedo-or sunlight reflected by the ground-at White Sands, the team found that the sand became drier and more reflective until it was a mass of loose sediment susceptible to strong winds.
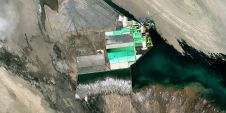
ASTER images from the project illustrate the increase in albedo and decrease in soil moisture preceding the 2008 White Sands dust storm. The photographs are from November 2002 to 12th March 2008, two days before the sandstorm.
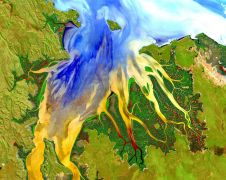
In the first set of pictures, the bright, white area representing albedo has expanded to an area of several kilometers by 12th March 2008. Meanwhile, the corresponding thermal image-as shown in panel 7 of the second image set-shows the driest area (in red) covering roughly the same area. The third image is of the 14th March 2008, dust storm taken by NASA's Moderate Resolution Imaging Spectroradiometer with the dust plume emanating from a darkened area that corresponds with the driest areas indicated by ASTER. Wind speed during the storm averaged between 10 and 15 miles per hour with gusts of more than 50mph, Scheidt noted in the group's paper.
The researchers plan to build on their work at White Sands by observing arid and semi-arid areas with different soil characteristics, particularly albedo, which is uniquely high at White Sands. They also suggested that monitoring desert areas via ASTER can be further validated with field measurements of soil density, moisture, and composition.

Value staying current with geomatics?
Stay on the map with our expertly curated newsletters.
We provide educational insights, industry updates, and inspiring stories to help you learn, grow, and reach your full potential in your field. Don't miss out - subscribe today and ensure you're always informed, educated, and inspired.
Choose your newsletter(s)